Seismic Interpretation Software

Geomage g-Spaceâ„¢ is a very easy to learn complete geological interpretation software that allows thorough analysis of existing seismic and well data. It includes many graphical and interactive features that makes interpreter’s work more enjoyable, efficient and accurate. All that at the most cost-effective pricing and world-class support.

Geomage g-Spaceâ„¢ software brings:

  • Advanced 2D/3D graphics and well-defined project data management
  • Interactive and intuitive horizon and fault picking
  • Horizon mapping with faults
  • Well-tie and Well correlation flows
  • Robust velocity modeling based on checkshots, markers and horizons
  • Depth conversion and simultaneous time/depth picking
  • Most cost-effective software in the market
  • complete demo project based on Teapot Dome data, provided by RMOTC and the U.S. Department of Energy as the data source
  • Many more features to come – talk to us


      Seismic interpretation

      • Dynamic synchronization between all views
      • Horizon picking and management
      • Simultaneous horizons interpretation on 2D, 3D or arbitrary line view
      • Interactive picking in time or depth domains
      • Import/export horizons in ASCII and some other formats
      • Horizon map creation
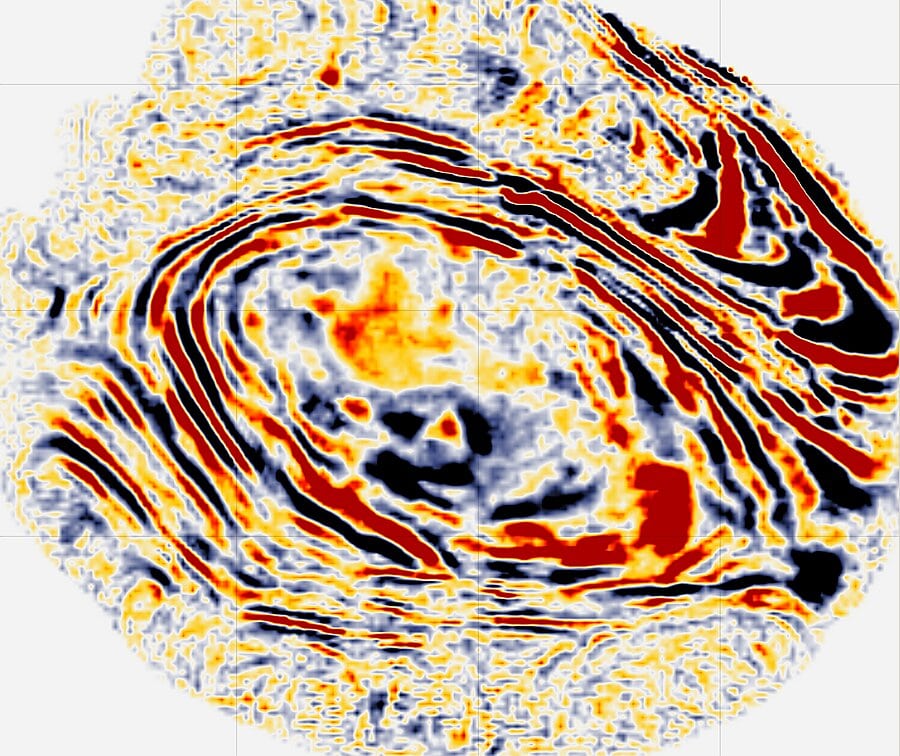
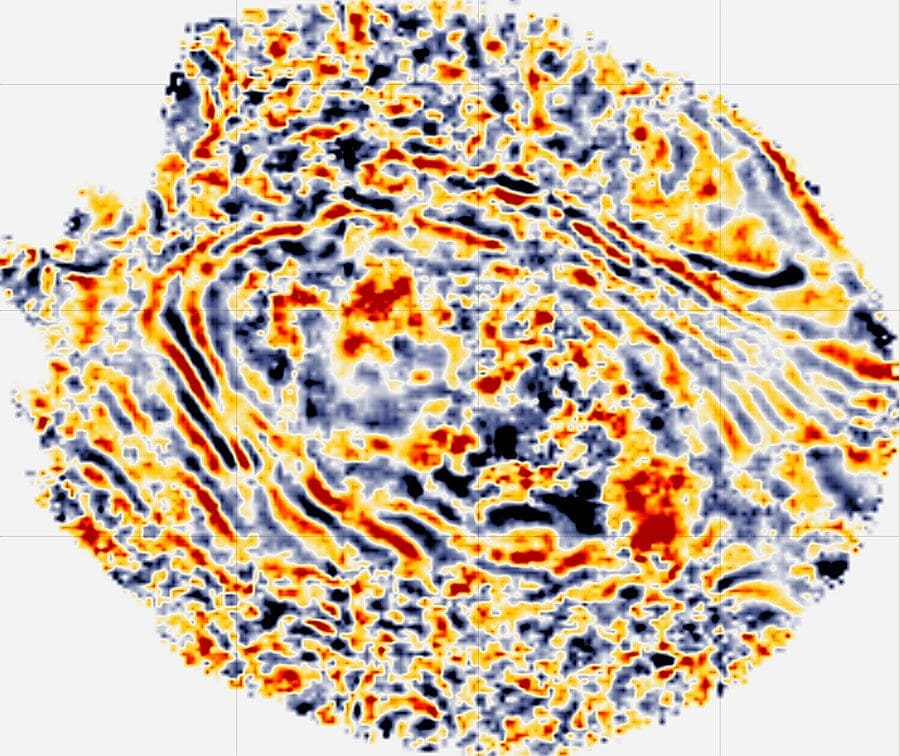
      • Horizon amplitude and attribute extraction
      • Flattening to any horizon
      • Built-in stratigraphic time scale
      • 2D/3D arbitrary line
      • Well-organized project structure
      • Showing contours on horizons in 2D and 3D

      2D/3D visualization

      • Accurate 2D/3D visualization of all sub-surface information of the project
      • 2D and 3D displays in time or depth
      • 2D and 3D seismic arbitrary line views
      • Integrated and synchronized visualization between all 2D and 3D views
      • Transparent visualization of velocity or other attributes on seismic
      • Velocity model QC (PineChart)
      • Well arbitrary line view
      • Multiple seismic versions animation for each dataset
      • Crossplotting
      • Well-log 3D visualization
      • And many more …

      Well-tie flow

      • Correlate any seismic around the well with actual sub-surface data
      • Create synthetic seismic log
      • Intuitive picking of tie points
      • Real-time update of markers on seismic view
      • Create/update/export of checkshot
      • Shift/stretch/squeeze synthetic seismic to tie with seismic data

      Well correlation

      • Well arbitrary line visualization
      • Interactive picking of horizons along markers
      • Handling thousands of wells
      • International stratigraphy colors
      • Numerous tracks per well
      • Templates for well log visualization
      • Flattening to horizon or datum
      • Simultaneous zoom/scroll along all wells
      • Snip box (for easier correlation)
      • Constant/relative distance between the wells
      • Linear/Log/Discrete log visualization

      Fault picking

      • Picking fault in any projection: 2D/3D/Slice/Horizon
      • Picking fault sticks
      • Assigning/re-assigning fault sticks to any fault
      • Show fault trend on location map by palette
      • Automatic fault type and direction visualization
      • Incorporate faults into map creation