



SEG-Y viewer
Open any SEG-Y. See it instantly.
g-Viewer is Geomage's SEG-Y data visualization and quality-control software — drag-and-drop loading for any dataset size, multiple datasets in one synchronized workspace, interactive location maps, and full pre-stack and post-stack QC with 3D views.


Four toolsets. One viewer.
From instant loading to deep pre-stack and post-stack QC — everything a geoscientist needs to see, check and share SEG-Y data.
Visualization & QC Workspace
SEG-Y visualization and quality control for any dataset size, in a customizable workspace of adjustable, linked panels.
- Fast loading with drag and drop
- Multiple datasets in one workspace
- Synchronized view navigation across panels
- Full control of trace headers, styles, filters, normalization
- Interactive location map for geometry QC
- Scale bars, ruler and snapshot tools

Multiple Datasets & Geometry Tools
Bring in whole surveys at once — bulk SEG-Y loading, geometry from trace headers, and instant access from a location map.
- Bulk loading of multiple SEG-Y files and geometry from trace headers
- Edit / save EBCDIC and Bin headers; standard & custom SGY header formats
- Select seismic datasets directly from the location map
- Geographic ASCII data; data preview without loading
- Preserved zoom when switching versions of the same line
- Automatic folder synchronization for instant data loading
Pre-stack QC Tools
Inspect CS, CR and CDP gathers with velocity overlays, animation, spectral analysis and header-driven QC displays.
- CS / CR / CDP gather display with common-gather grouping
- Common-gather animation at user-defined speed
- Velocity line plotted on top of gathers for QC
- Cross-plot of any three trace headers; spectral analysis of multiple areas
- AGC / bandpass; region zoom map with header-based symbols
- 3D view for pre-stack data; 2D line display across survey volume

Post-stack Data Views & QC
Wiggle and variable-density sections, 3D volumes with opacity, palettes and header plots — and annotated, to-scale image export.
- Wiggle and/or variable density; changeable seismic palettes
- Zoom by axis drag, mouse wheel or toolbar; advanced crop by IL/XL/time
- Trace headers plotted above the seismic as graphs or values
- Spectral analysis (multiple areas); AGC / bandpass; legend & colorbar
- Synchronized selected-trace display; region zoom map
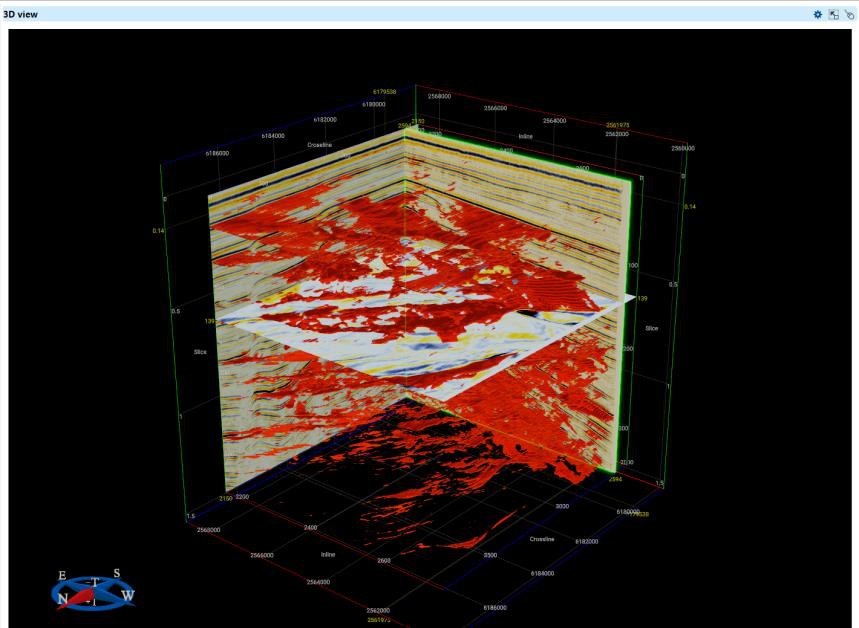
- 3D view for post-stack volumes with opacity mode
Start free. Grow when ready.
g-Viewer is free to start — a fully functional trial with auto-update, so you always run the latest version.
Fully functional free trial — drag-and-drop SEG-Y loading, multi-dataset workspace, pre-stack and post-stack QC, 3D views, and auto-update with every new release.
Download nowThe extended edition for power users — with a 3-month free trial offer. See the pricing page for current plans and what's included.
See pricingEvery g-Platform seismic processing license ships with g-Viewer, so processing teams and their clients review data and results in the same viewer.
About g-PlatformUniversities & research institutions: the full suite is free for teaching and non-commercial research under the Academic License Program.
From file to figure in six steps.
Your data, every angle.


A viewer built by processors.
Your files. Your machine.
The viewer that ships with a platform.


Questions, answered.
What is g-Viewer?
Is g-Viewer really free?
Which platforms does it run on?
What data and header tools are included?
What can I do with pre-stack data?
What can I do with post-stack data?
Where can I download the free SEGY viewer?
Is there a SEG-Y viewer for Mac?
How does g-Viewer relate to g-Platform?
Your SEG-Y, on screen in minutes.
Download the fully functional free trial — drag in a SEG-Y and start QC-ing. Windows, Linux and macOS (Apple Silicon), with auto-update always keeping you current.